
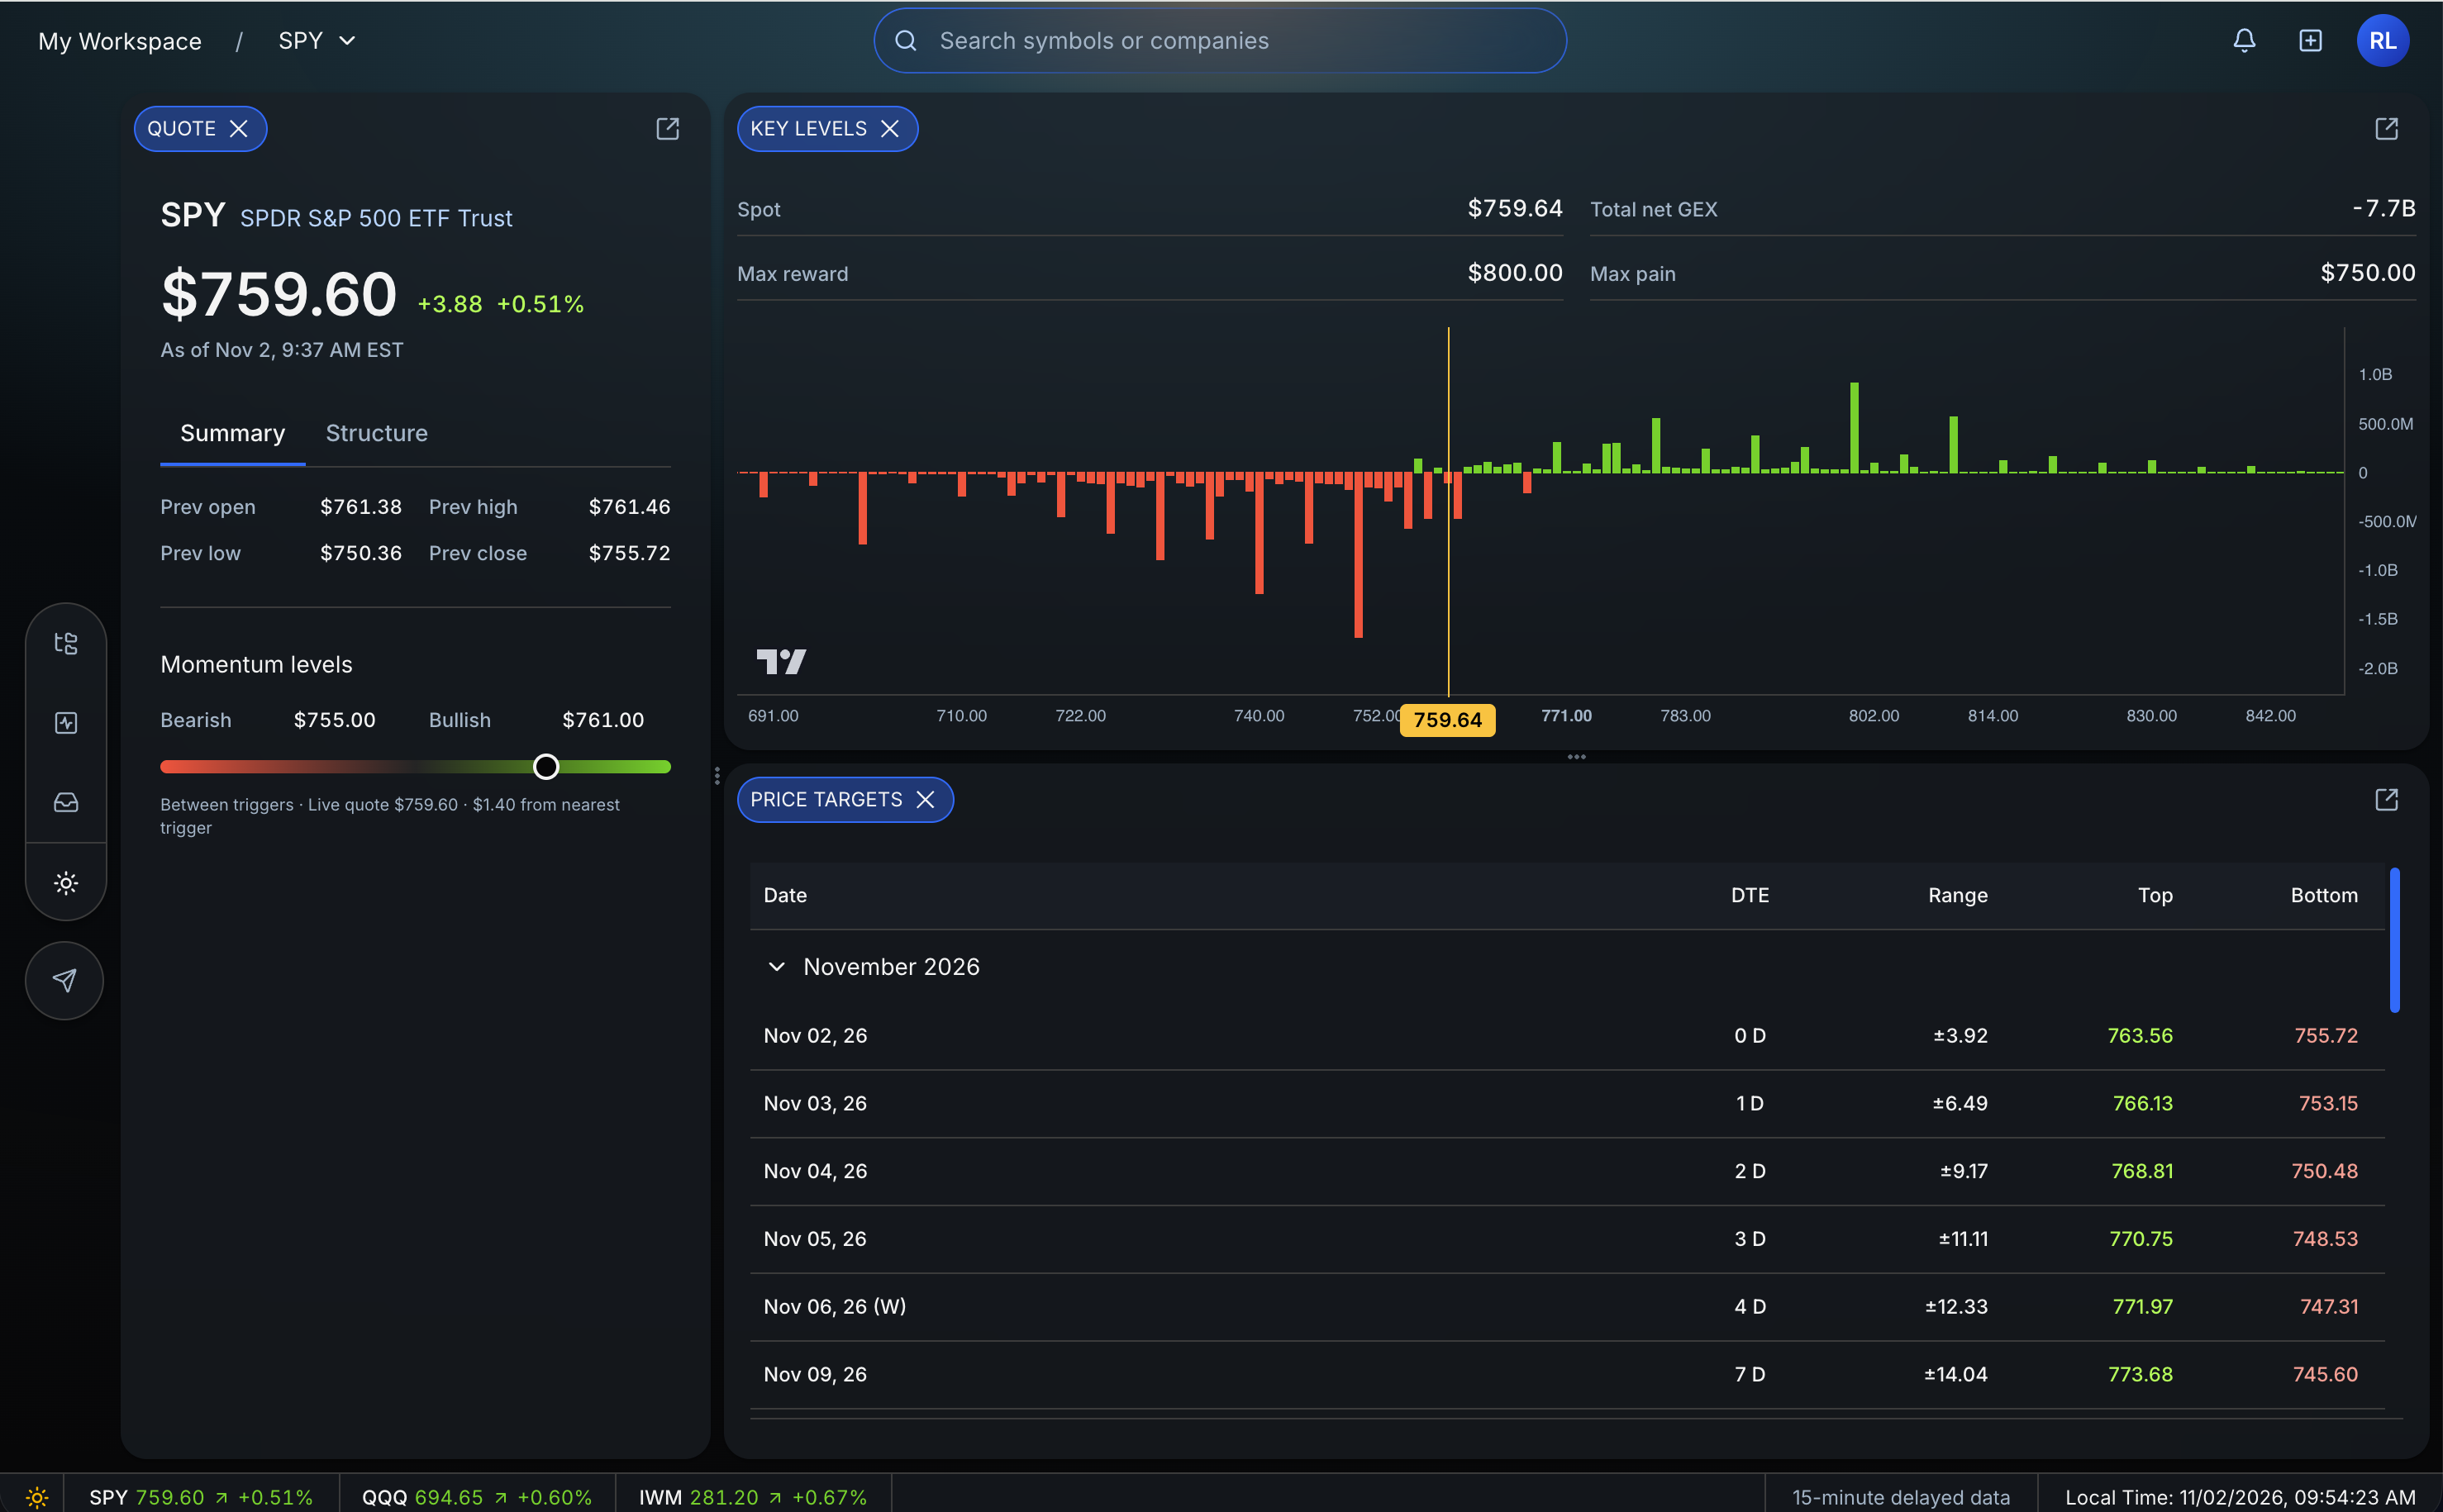
Support and resistance trading uses price areas where traders reacted before to plan the next decision. Support is where buying showed up. Resistance is where selling showed up. Neither one is a guarantee. Treat every level as an area where you need evidence, not as a line price must obey.
Information and Eden product behavior checked November 2, 2026.
Key takeaways
- A level is a price or zone where traders reacted before.
- Support is where buying showed up. Resistance is where selling showed up.
- A useful level has a job: entry area, target, risk floor, or line where the idea is wrong.
- A level is a decision area, not a guarantee that price will hold or reverse.
What is support and resistance in trading?
Support is a price area where buyers previously became more active than sellers. Resistance is an area where sellers previously became more active than buyers.
Think of support as a floor that has held weight before. Think of resistance as a ceiling that has stopped a move before. A floor can crack. A ceiling can break. The comparison helps you locate the area, but it does not tell you what will happen next.
The useful question is not, “Will this level hold?” Ask:
- What did price do here before?
- What must price do now before I enter?
- Where is the line that proves my idea wrong?
- Is there enough room to the next target?
What are support and resistance levels in trading?
Support and resistance levels are reference prices or zones. Traders often find them at prior highs and lows, the edges of a range, an opening range, a gap, a high-volume area, or a price where options positioning is concentrated.
The same price can change roles. Resistance can become support after price breaks above it and holds. Support can become resistance after price breaks below it and fails to reclaim it.
A level becomes more useful when you give it one job:
| Job | Question the level answers |
|---|---|
| Entry area | Where will I look for confirmation? |
| Invalidation | What price action proves the idea wrong? |
| Target | Where might the move slow, reject, or complete? |
| Context | Is price in a favorable part of the range? |
For a premarket example, see where to get SPY and QQQ key levels before the market opens.
Support and resistance trading strategy
A support and resistance trading strategy needs more than a line on a chart. It needs a condition, a risk floor, a target, and a response if price breaks the level.
Use this five-part plan:
- Mark two or three levels you can explain.
- Label each level as entry, invalidation, target, or context.
- Write the confirmation you need: hold, rejection, reclaim, or break.
- Set the line where the idea is wrong before entering.
- Check the sleep test: if the position moves against you overnight, is the planned loss still acceptable?
Suppose price approaches support. Buying simply because the line exists is not a complete strategy. A plan might require price to trade below the area, reclaim it, and then hold above it. The failed move below support becomes evidence. The low of that failed move can provide a clear invalidation reference.
How to use support and resistance in trading
Start with the larger chart and move toward the entry chart. Mark the broad areas first so a small intraday move does not hide the bigger context.
Then wait for price to interact with the level:
- Hold: price reaches the area and stays on the expected side.
- Rejection: price tests the area and quickly moves away.
- Reclaim: price crosses the level, returns to the expected side, and holds.
- Break: price accepts beyond the area instead of immediately returning.
Do not enter because price is merely close. Let the reaction tell you whether the level is active. Waiting for price confirmation can reduce the urge to predict every touch.
Before placing the trade, write the entry area, risk floor, line where you are wrong, and first target. If you cannot name all four, the map is not finished.
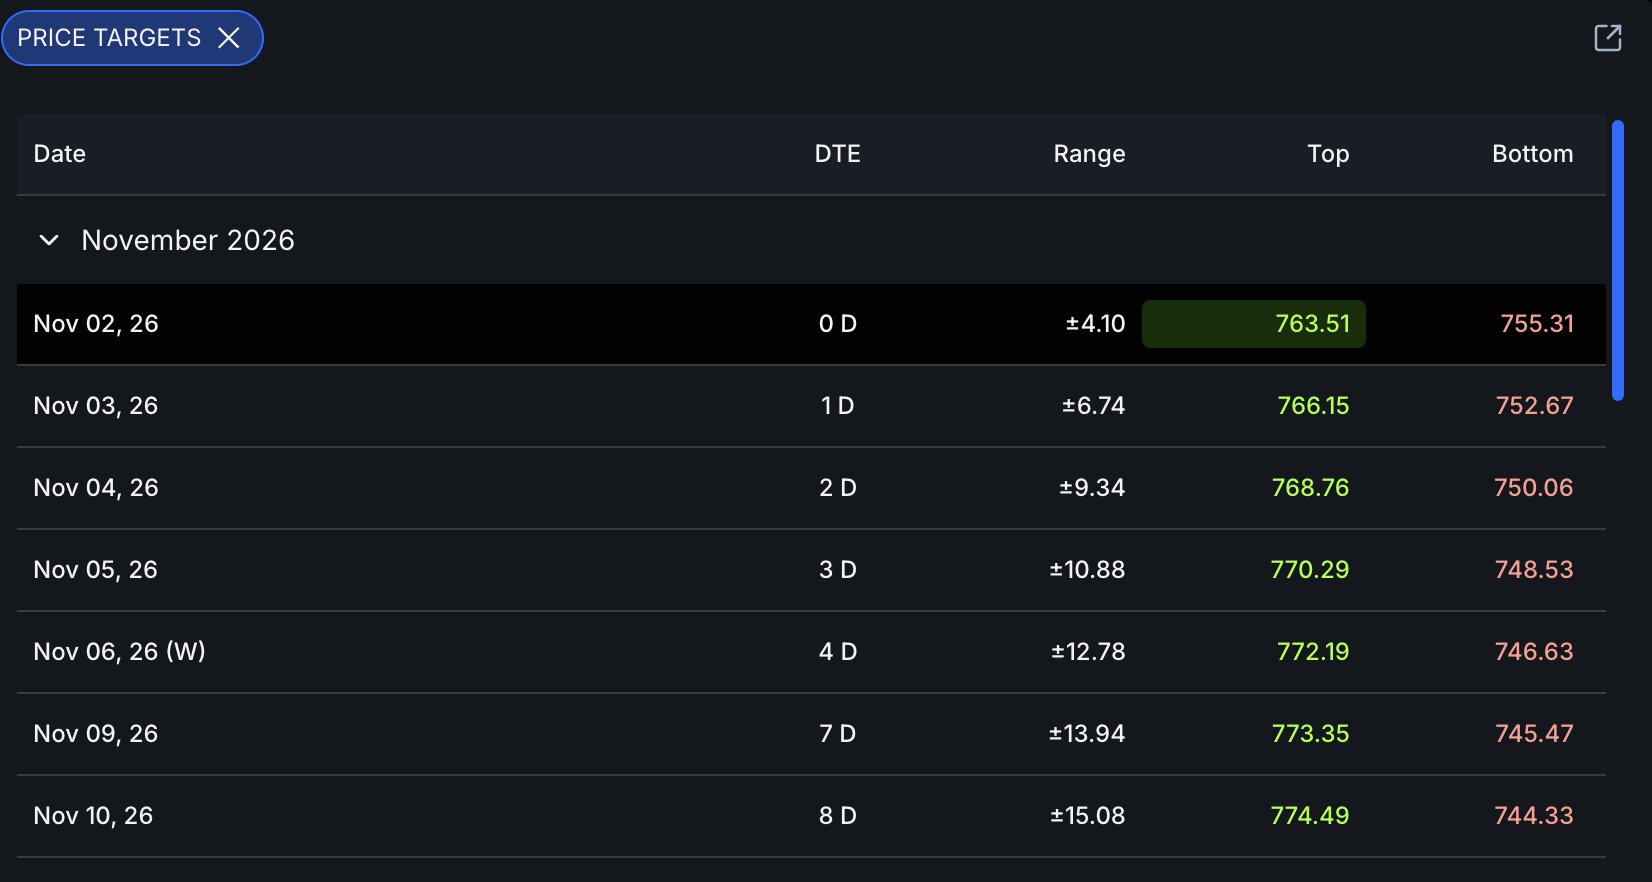
Support and resistance trading chart
A readable trading chart does not need a line at every turn. Too many levels create a story for every possible outcome.
Use a simple chart review:
- Start with weekly and daily structure.
- Mark the clearest swing high and swing low.
- Add the prior session high and low if they matter to the trade horizon.
- Keep the next meaningful area above and below current price.
- Remove any line that does not change a decision.
The chart should make the plan easier to see. For index and futures context, compare the workflows for ES with SPY options levels, NQ with QQQ options levels, and gold futures with GLD options levels.
Support and resistance indicator
There is no single support and resistance indicator that proves where price will reverse. Indicators can organize inputs such as prior highs and lows, pivots, volume, volatility, or options positioning. The trader still has to decide whether the output matters to the setup.
An indicator is most useful when its level has a clear calculation and a clear role. It is less useful when it fills the chart with unexplained lines.
If you want the levels visible on a chart, read about options-based support and resistance in TradingView. Whatever tool you use, verify the current value and define the reaction you need before entering.
Traditional levels vs options-derived levels
Traditional levels come mainly from price history. Options-derived levels add context from the options market. They answer related but different questions.
| Decision | Traditional level | Options-derived level |
|---|---|---|
| Source | Prior price action, ranges, gaps, or volume | Options positioning around specific prices and expirations |
| Main use | See where price reacted before | See where positioning may create another decision area |
| Best feature | Easy to verify on the chart | Adds context that price history alone does not show |
| Main limit | Different traders may draw different lines | The level still needs price confirmation and can fail |
Eden names P-Trans as a bullish transition reference and N-Trans as a bearish transition reference. Those roles are plain-language context, not instructions to buy or sell. Eden does not place trades and is not a broker.
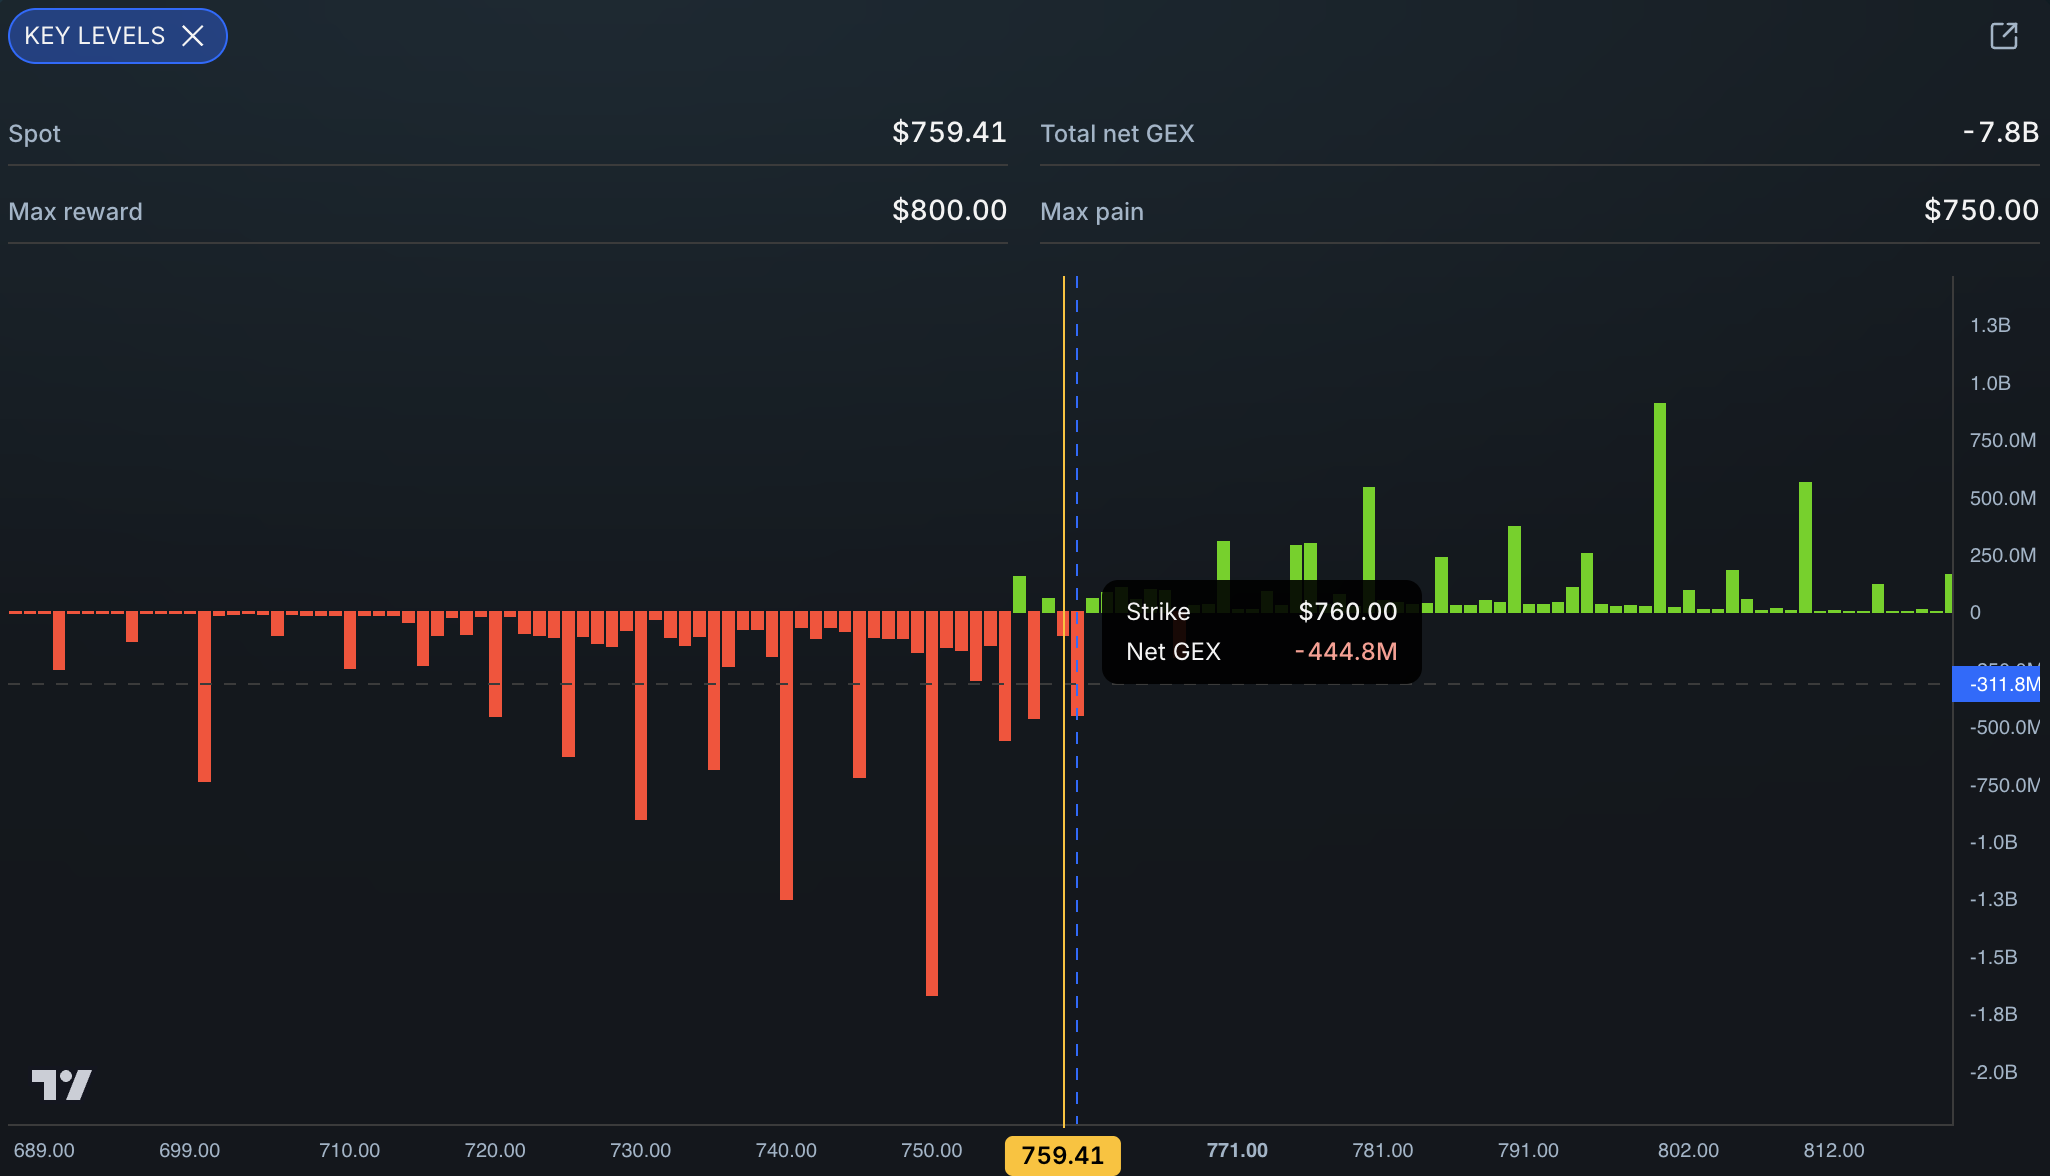
You can keep the traditional levels you trust and compare them with Eden. The full workflow is in Eden vs. drawing support and resistance by hand.
When levels fail
Support fails when price breaks below it and cannot reclaim it. Resistance fails when price breaks above it and continues to hold. A failed level is information, not a reason to widen risk and hope.
Levels fail because conditions change. News can reset expectations. A large order can overwhelm the area. Momentum can persist longer than expected. The original reaction may have already used the available supply or demand.
Plan failure before the trade:
- Define the exact close, hold, or break that invalidates the setup.
- Size the position so that invalidation produces an acceptable loss.
- Do not move the line simply because price reached it.
- Reassess only after new structure forms.
A broken level can later become useful from the other side. Wait for that new role to appear. Do not assume it immediately.
Frequently Asked Questions
What is support and resistance in trading?
Support and resistance are price areas where traders reacted before. Support is an area where buying appeared, while resistance is an area where selling appeared.
What is resistance and support in trading?
Resistance is a price area where selling has slowed or rejected a move higher. Support is a price area where buying has slowed or rejected a move lower.
What are support and resistance levels in trading?
They are reference prices or zones used to plan decisions. A trader may use one as an entry area, target, risk floor, or the line where the trade idea is wrong.
How to use support and resistance in trading?
Mark a small number of levels, decide what price must do at each one, and define the invalidation before entering. Wait for a hold, rejection, reclaim, or clean break instead of assuming the level will work.
What does support and resistance mean in trading?
It means price has reached an area where supply and demand may change the next decision. The area is context, not a promise that price must reverse.
Is support and resistance trading profitable?
There is no guaranteed profit rate. Results depend on the plan, execution, risk limits, trading costs, and whether the trader exits when the original idea is invalidated.
Takeaway
Support and resistance trading works best as a planning method. Mark a small number of levels. Give each one a job. Wait for price to confirm the reaction. Define the line where you are wrong before you enter.
The level does not owe you a bounce or rejection. Your edge comes from making the next decision clear before pressure arrives.