Vanna exposure, or VEX, estimates how options delta may change when implied volatility changes. Traders may treat large VEX concentrations as places to investigate. Think of them as places to watch, not promises about where price will go.
Eden does not provide a Vanna Exposure widget or VEX data. This article explains the calculation for education and for readers comparing options-positioning methods.
What is Vanna?
Vanna is an options Greek. It measures how an option’s delta changes when implied volatility changes. Delta is a rough measure of how much an option reacts when the stock or ETF moves.
When delta changes, an options market maker may need to change a hedge. It is like adjusting your balance when the floor moves under your feet.
In practical terms, Vanna helps answer this question: If implied volatility changes, how might the directional exposure of an options position change with it?
When a tool adds these estimates across many options, the result is called Vanna exposure, or VEX. Each data provider makes assumptions about who owns the options. That is why two tools may show different numbers.
How do you calculate Vanna exposure?
Vanna is the change in delta for a change in implied volatility. In calculus form:
Vanna = ∂Delta ÷ ∂Implied Volatility
For one option in a public options-chain estimate, a common dollar-VEX formula is:
Dollar VEX = vanna × open interest × contract multiplier × spot price × 0.01
The 0.01 converts a one-percentage-point volatility move into decimal form. For example, it converts a move from 20% implied volatility to 21% into 0.01. If a data source already reports Vanna per one volatility point, do not multiply by 0.01 again.
To estimate VEX for the entire symbol, add the signed values for all included options:
Net VEX = Σ(position sign × vanna × open interest × multiplier × spot price × 0.01)
The sigma symbol, Σ, means “add every matching option together.” The position sign is positive for an assumed long option position and negative for an assumed short option position. Public open interest does not reveal whether dealers are long or short each contract, so a dealer-VEX chart must apply a documented assumption.
Calculating total VEX requires the full options chain across every included strike and expiration. Each row needs Vanna, open interest, contract multiplier, and the current spot price. A standard U.S. equity or ETF option usually represents 100 shares, but adjusted contracts and other products can use a different multiplier.
VEX is a snapshot. Vanna, implied volatility, spot price, and time to expiration can change, while open interest is not a live position ledger.
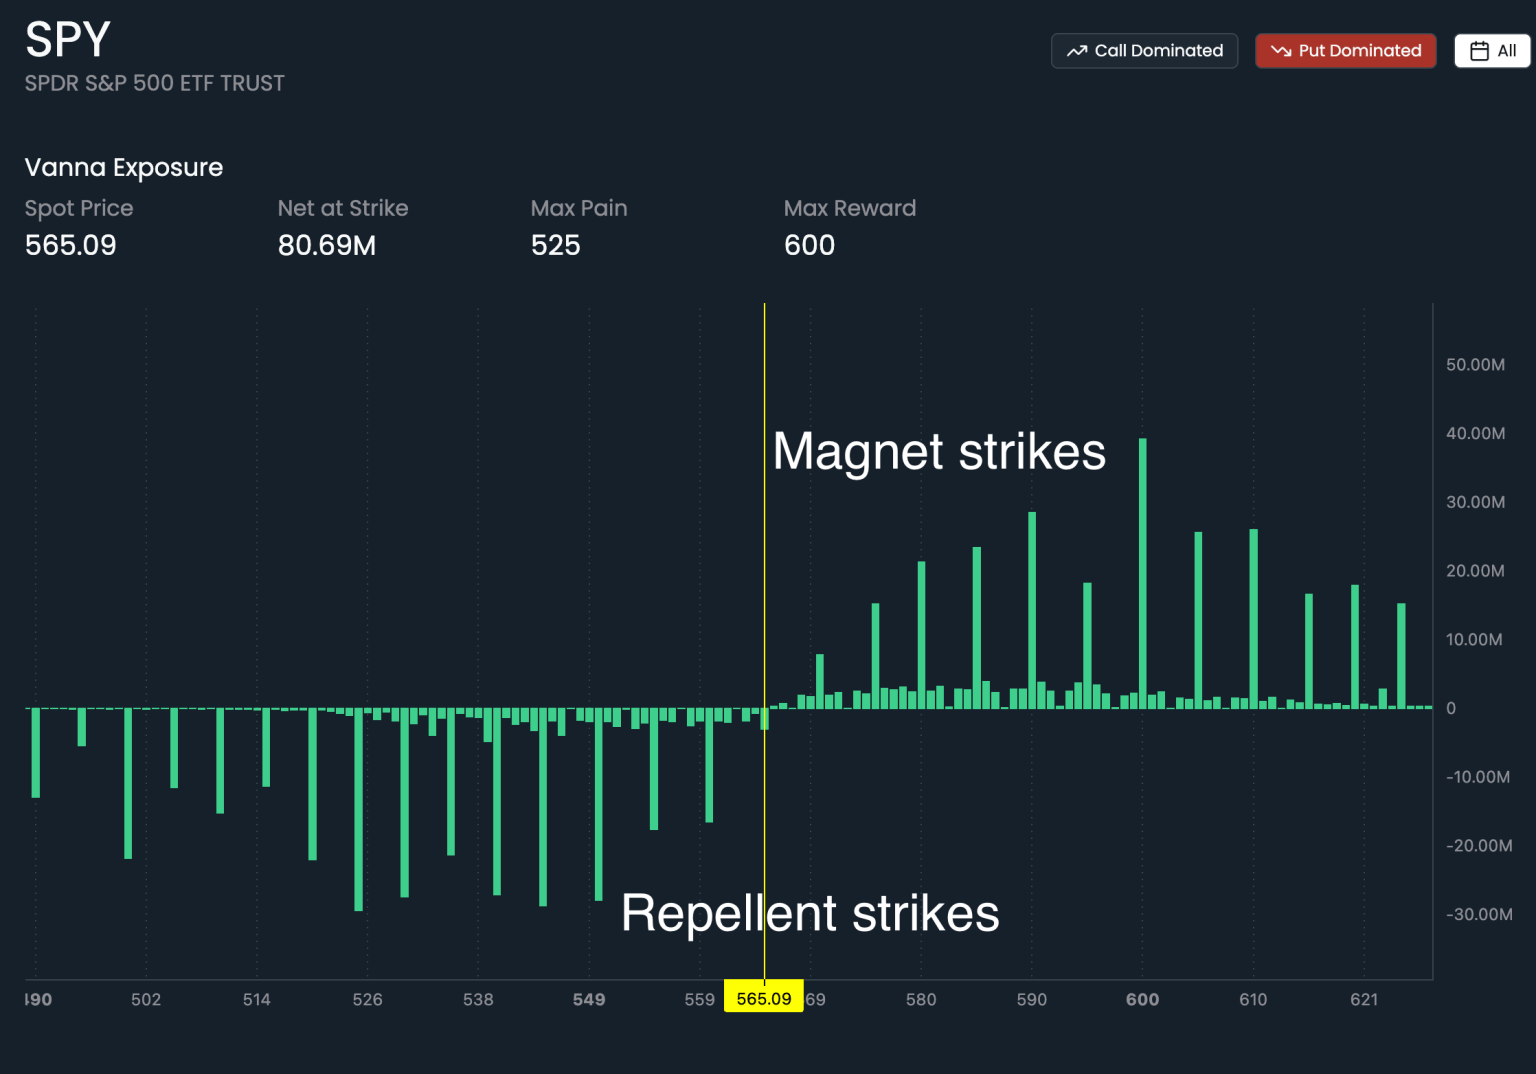
Why traders call strikes magnets or repellents
Traders call a strike a magnet when possible hedging may pull price toward it. They call it a repellent when that activity may push price away. These words describe an idea to test. They do not predict the next move.
The sign of a VEX estimate alone does not determine the next move. The effect can change with:
- The underlying price and its distance from the strike
- The direction and size of the volatility change
- Time remaining until expiration
- The actual long or short positioning held by dealers
- Gamma, liquidity, news, and broader market conditions
Use a VEX level like a road sign. It tells you to pay attention as price gets close. It does not tell you which turn price will take.
When Vanna exposure may matter most
Vanna may matter more when implied volatility moves fast or when many options sit near the current price. It can also get more attention near expiration because options positions can change quickly. There is no set day when VEX must control price.
Before expiration, check whether the open interest is actually concentrated, whether implied volatility is rising or falling, and whether price is close enough to the relevant strikes for the exposure to matter.
A practical VEX workflow
1. Mark the largest nearby concentrations
Start with the tallest positive and negative VEX bars near the current price. A large bar far away may not help with today’s trade.
2. Write a conditional expectation
Write an if-then plan instead of guessing. For example: If price reaches this strike, holds it, and volatility falls, I will watch for a move toward the next level.
3. Watch the reaction
Let price make the final decision. Watch for a hold, reclaim, rejection, or clean break. That reaction matters more than the word “magnet” or “repellent.”
4. Combine Vanna with gamma
Vanna looks at changes in volatility. Gamma looks at changes in price. Reading both can give you a wider view of possible hedging activity. Start with the definitions of GEX and GEX levels, then use the gamma exposure guide for the full calculation and workflow.
What VEX cannot tell you
VEX cannot show every trader’s position. It cannot guarantee how a market maker will hedge. The estimate can also become old as price, volatility, and open interest change.
Use VEX to identify areas worth watching, then let the market’s response decide whether the level belongs in the trade plan.
Sources
- Options Industry Council, Delta
- Options Industry Council, Option Price Behavior
- OCC, Equity Options Product Specifications