Gamma exposure, or GEX, shows where options hedging may affect price as the market moves. Traders use large GEX bars as possible key levels. These levels may slow price, speed it up, or cause a reaction. GEX is an estimate, not a live view of every market maker’s position.
What is gamma exposure?
Gamma measures how fast an option’s delta changes when the stock or ETF moves. Delta is a rough measure of how much an option reacts to that move.
Options market makers may buy or sell shares or futures to balance their risk. When delta changes, they may need to adjust that hedge. Think of a driver making small steering changes as the road bends. GEX adds up an estimate of those possible changes across many options.
How do you calculate spot gamma exposure?
A common spot-GEX formula estimates how much dollar delta may change if the underlying moves 1%. For each option contract in the chain, use:
GEX = gamma × open interest × contract multiplier × spot price² × 0.01
Using a common simplified convention that assigns call GEX a positive sign and put GEX a negative sign, the two sides are written as:
Upside, or call-side, GEX = Σ(call gamma × call open interest × multiplier × spot price² × 0.01)
Downside, or put-side, GEX = −Σ(put gamma × put open interest × multiplier × spot price² × 0.01)
Net spot GEX = upside GEX + downside GEX
The sigma symbol, Σ, means “add every matching option together.” For a standard U.S. equity or ETF option, the contract multiplier is usually 100. Adjusted contracts and some other products can use a different multiplier.
This calculation requires the full options chain if the goal is total spot GEX for the symbol. That means calls and puts across every included strike and expiration, with gamma and open interest for each contract. Using only one strike, one expiration, or the contracts visible on part of a screen produces only a partial estimate.
The result also depends on the chain snapshot. Gamma changes with spot price, time, and implied volatility, while open interest is not a live record of who owns each position. The plus sign for calls and minus sign for puts is a modeling convention based on an assumed dealer position. Public chain data cannot confirm that assumption for every contract.
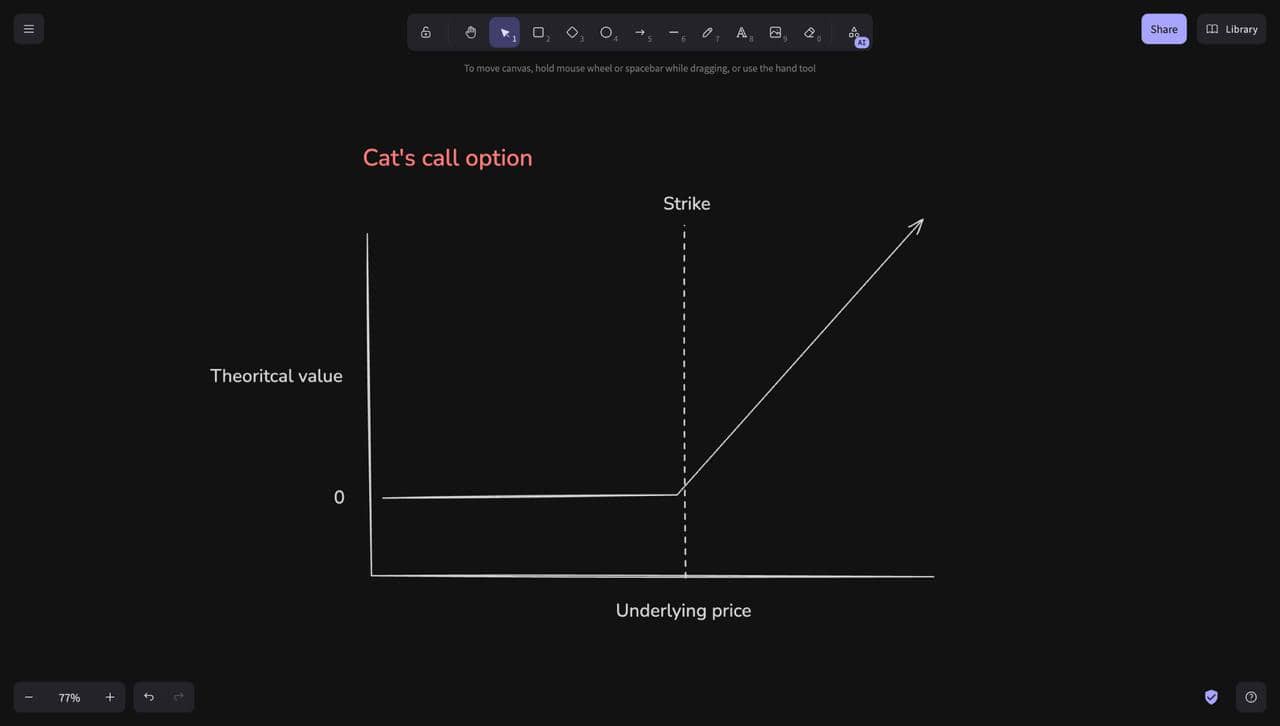
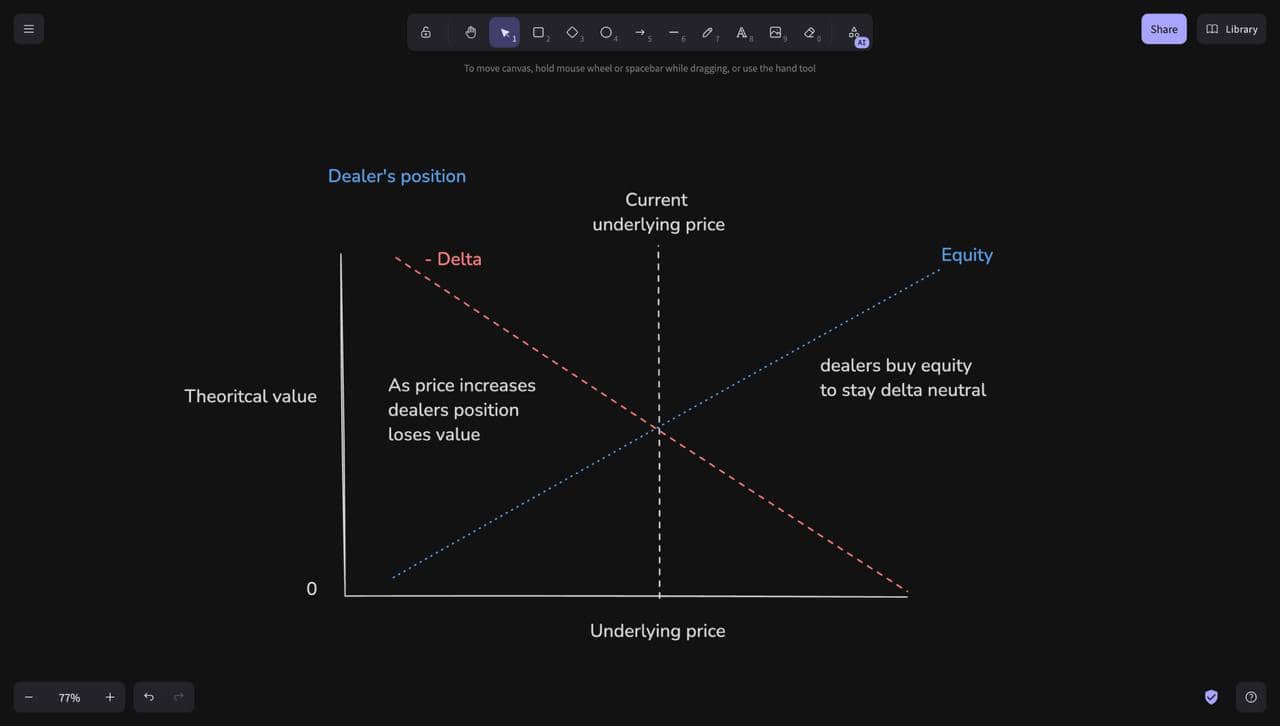
Positive and negative gamma environments
In a common model, positive gamma may lead to selling as price rises and buying as price falls. That can slow the market down. Negative gamma may lead to hedging in the same direction as price. That can make a move faster or less stable.
This model depends on guesses about who is long and who is short. Public options data does not show every position. Treat the sign and size as clues.
Reading a gamma profile
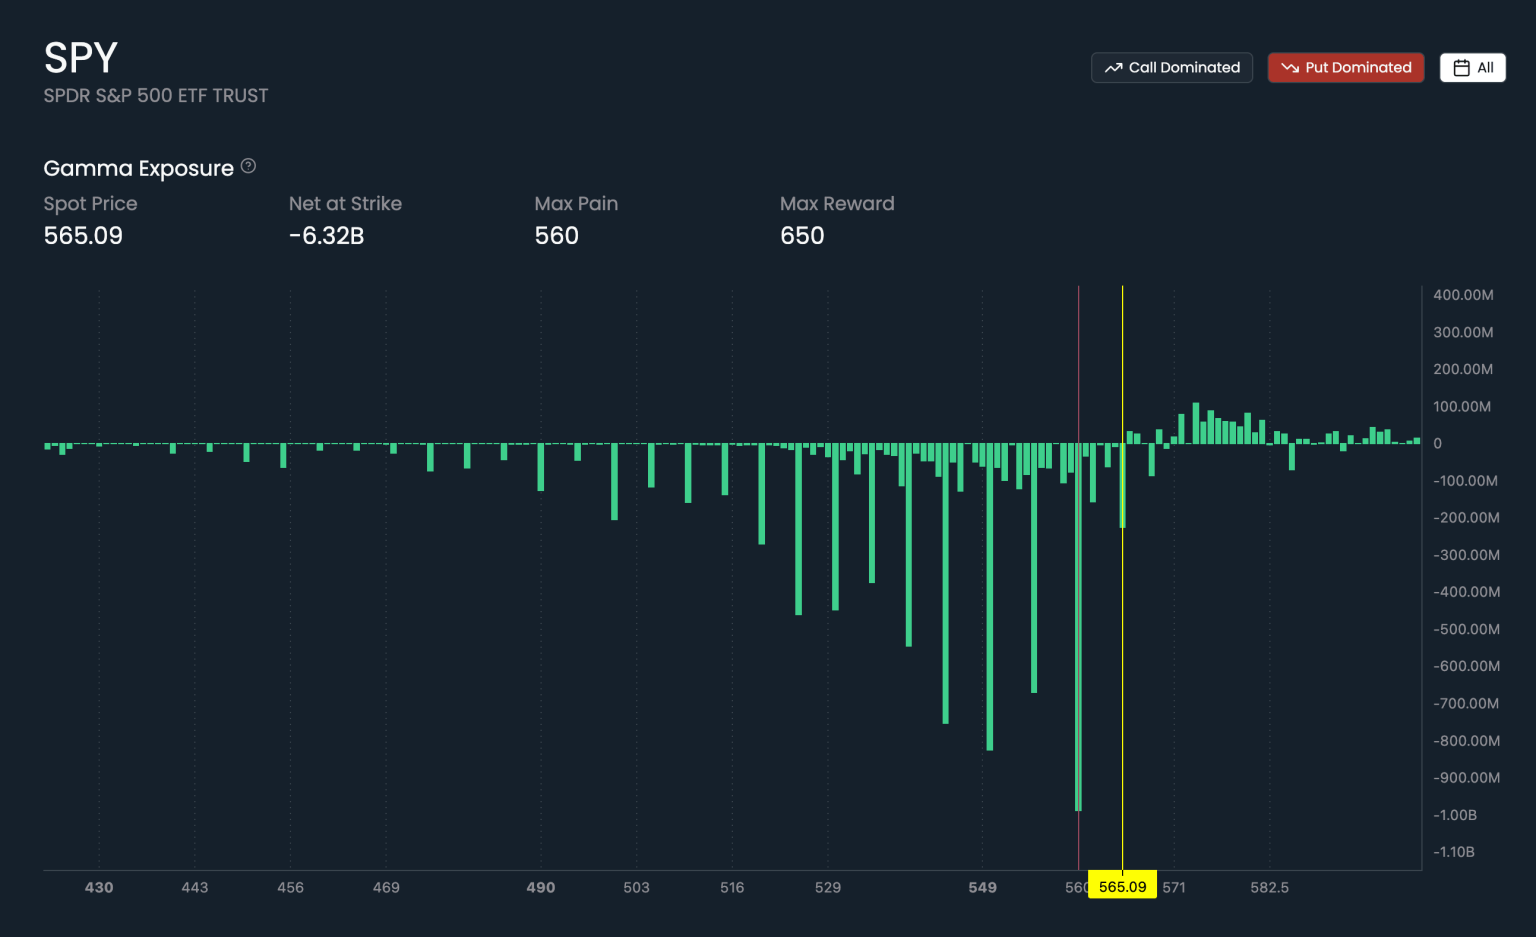
Start with three questions:
- Where are the largest nearby concentrations? Large positive or negative bars can mark strikes worth watching.
- Where is the underlying trading relative to them? A prominent strike far from spot may be irrelevant to today’s plan.
- How is the profile changing? Price, implied volatility, time, and position changes can all alter the estimate.
Gamma describes how delta changes with price. Vanna exposure adds another view by estimating how delta may change as implied volatility changes.
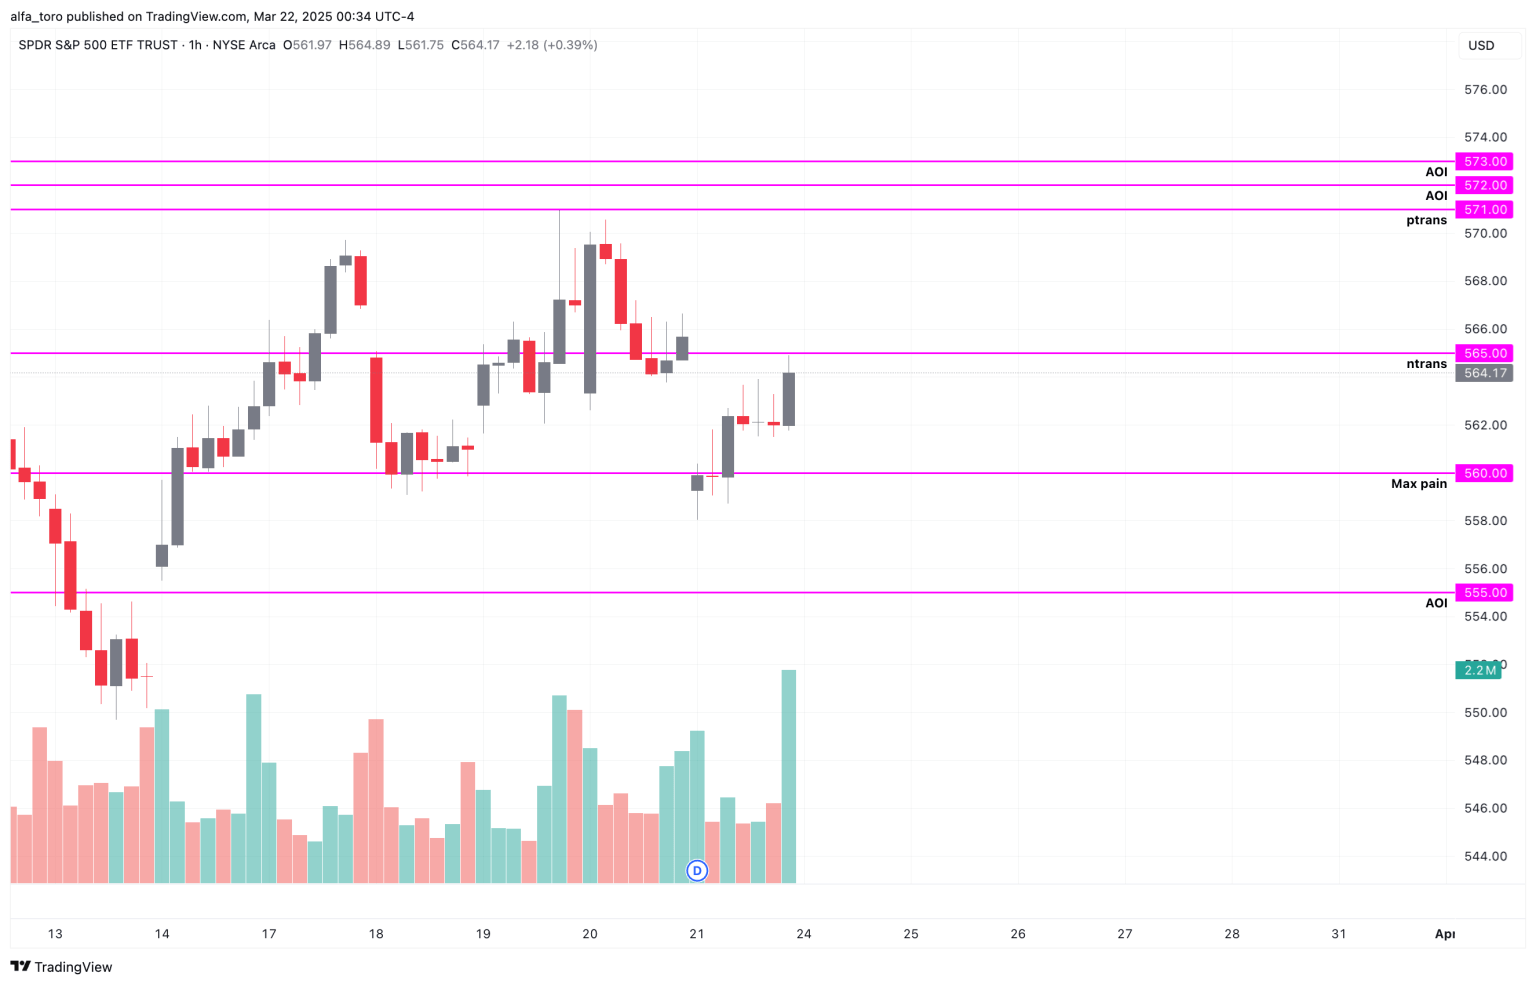
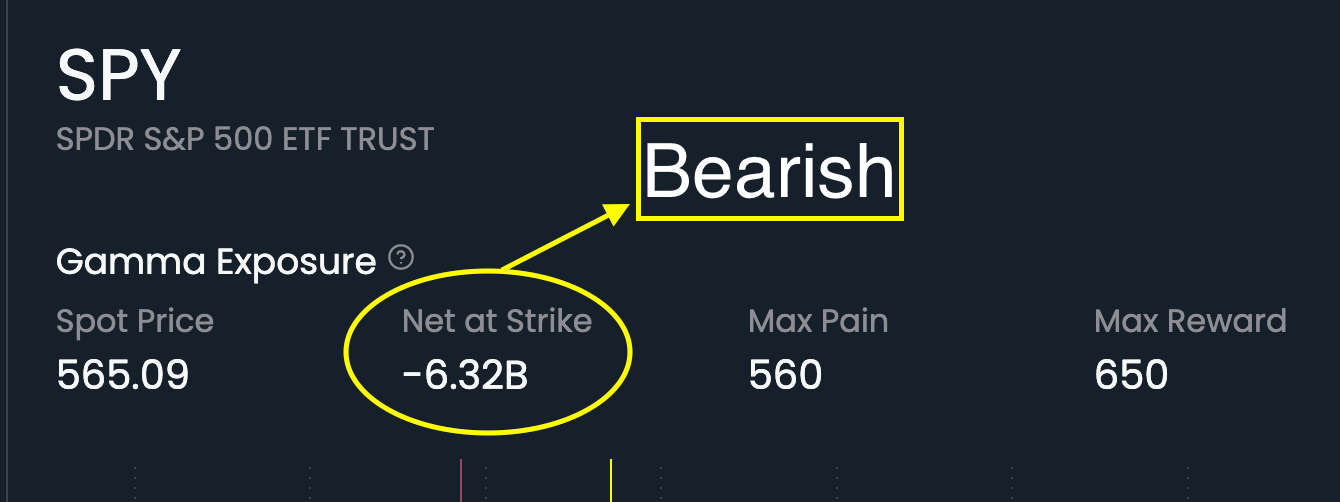
Eden labels important parts of the map. P-Trans is the bullish trigger level. N-Trans is the bearish trigger level. Tall bars can become areas of interest, or AOIs. Older versions also showed labels such as Max Pain and Max Reward. These labels help organize the chart, but they do not guarantee support or resistance.
Avoid fixed gamma thresholds
Do not use one fixed GEX number for every market. A large reading for SPY may mean something different for QQQ or a single stock. The number can also change with expiration dates and the data source.
Compare the current reading with recent readings for the same symbol. Then check where price sits next to the tallest bars. Let the price reaction test the idea.
Build a trade plan with GEX
1. Mark nearby areas of interest
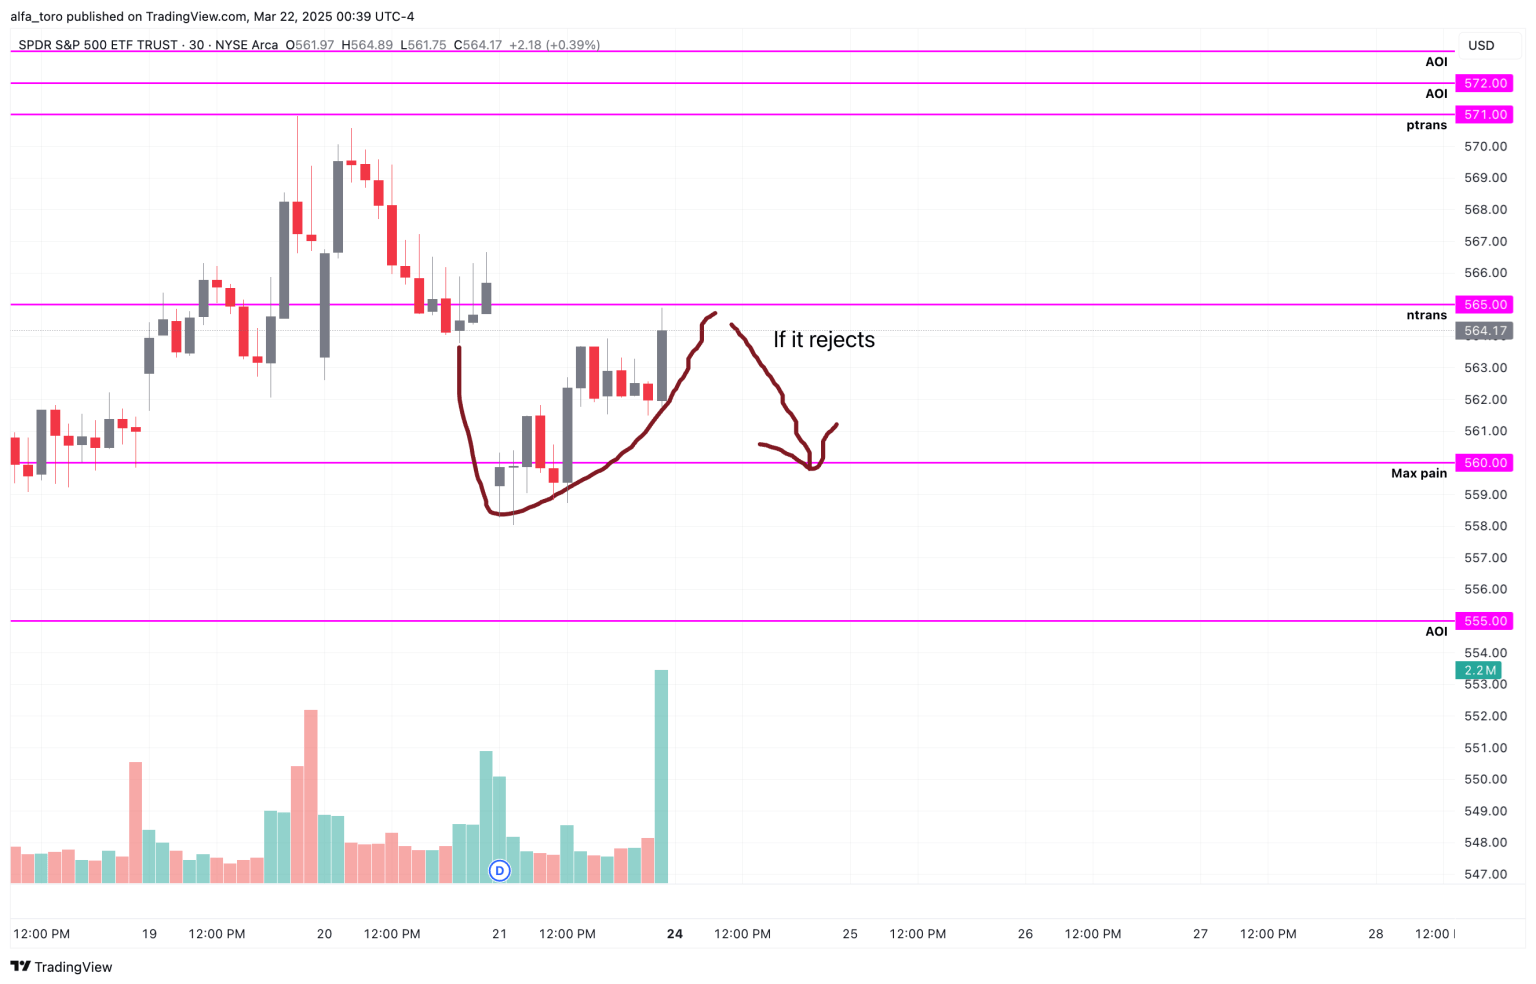
Find the tallest bars near the current price. Mark P-Trans, N-Trans, and any other unusually tall bar as an AOI.
2. Add price structure
Compare the GEX map with the levels already in your plan. When several clues point to the same area, that area may deserve more attention. When they disagree, slow down and wait for price to react.
3. Plan conditionally
Write down what price must do. For example: If price reclaims this level and holds it on a retest, I will watch the next AOI as a possible target.
4. Trade from one level to the next
Use the next level as a possible destination. Decide what would prove the idea wrong before you enter. A break does not guarantee that price will reach the next level.
Keep the model in perspective
GEX turns a large options market into a simpler map. Use the map to find places to watch, then let price confirm the trade. GEX cannot choose direction, show every trader’s intent, or account for surprise news.
For another volatility-sensitive positioning view, read Vanna Exposure: How Traders Read Potential Magnet and Repellent Strikes.
To compare data freshness, coverage, and planning workflows, review the best gamma exposure tools.
For a broader comparison across gamma, delta, vanna, hedging-flow, and research workflows, see the best dealer positioning tools.
Frequently asked questions
What does GEX mean?
GEX is short for gamma exposure. It is an estimate, built from the options chain, of how much hedging options market makers may need to do as the underlying price moves. Traders use it to spot strikes where hedging activity could slow price down, speed it up, or cause a reaction.
What is gamma exposure in options?
Gamma exposure is the combined effect of gamma across an options chain. Gamma measures how fast an option’s delta changes when the underlying moves. Adding up gamma and open interest across strikes and expirations produces a map of where dealer hedging pressure is likely to concentrate.
What are GEX levels?
GEX levels are the strikes or prices where estimated gamma exposure is unusually large. Because hedging flows cluster there, traders watch those levels as possible reaction areas and use them to plan entries, invalidation, and targets.
Is GEX meant for day trading or swing trading?
GEX can be used for both day trading and swing trading. Day traders may use current GEX levels to plan entries, invalidation, same-day targets, potential reactions, and momentum shifts. Swing traders may use the same map with daily or weekly structure and a longer target horizon. In either case, GEX supplies context and levels; price still has to confirm the trade.
How often should you check gamma exposure?
A swing trader may review gamma exposure once or twice a week and again when price approaches an important level or the options profile changes. A day trader may check it once before the session and once again during the day. Refresh it more often around major price moves, expiration, earnings, or volatility changes because GEX is dynamic.
Is GEX an indicator?
GEX is better described as an options-derived positioning metric than a traditional technical indicator. A traditional indicator usually transforms historical price or volume data. GEX is an estimate calculated from current options-chain inputs such as open interest, gamma, spot price, strike, expiration, and contract size, together with assumptions about dealer positioning. Traders use the resulting levels to estimate where dealer hedging may react to or influence price.
Sources
- Options Industry Council, Gamma
- OCC, Equity Options Product Specifications