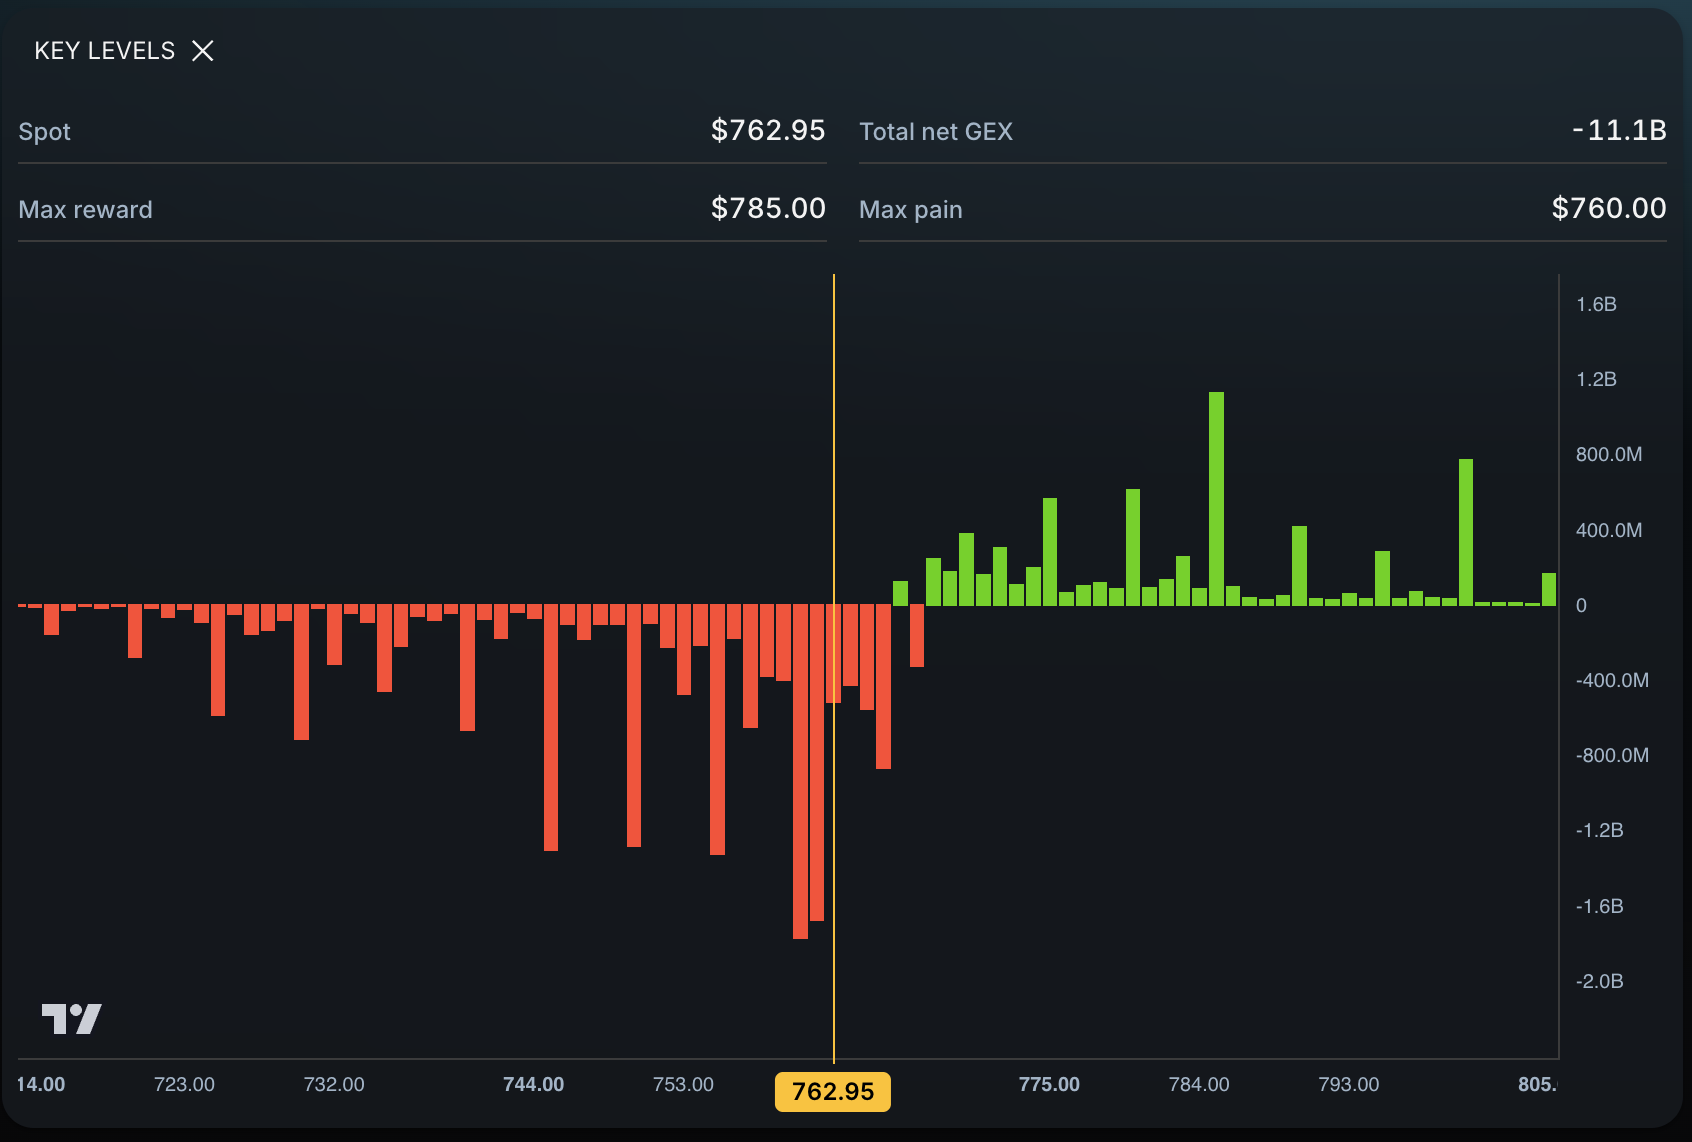
Volume Profile shows where substantial trading volume occurred at different prices. Options-derived levels show where options positioning may create another source of market pressure. One looks at traded price-and-volume history; the other adds options-market context. They can work together.
Volume Profile in plain language
Volume Profile displays how much volume traded at each price over a chosen period. High-volume areas show where the market spent more time doing business. Low-volume areas show prices where trading was lighter.
Traders often watch high-volume nodes for acceptance and low-volume areas for faster movement. The result depends on the selected period, so two profiles can show different maps.
What options-derived levels add
Options-derived levels identify prices that may matter because options positioning and related hedging are concentrated nearby. Eden shows current price with nearby key levels and potential price targets.
They do not show where all historical share volume traded. They provide a different source of context.
Options-derived levels vs. Volume Profile
| Question | Volume Profile | Options-derived levels |
|---|---|---|
| Where did substantial trading occur? | Core purpose | Not its purpose |
| Where may options positioning matter? | Does not directly answer | Core context |
| Does the chosen lookback matter? | Yes | The current analysis and available options context matter |
| Can it identify possible reaction areas? | Yes | Yes |
| Does it guarantee support or resistance? | No | No |
When Volume Profile may matter more
Volume Profile may lead when your setup depends on auction behavior, acceptance, rejection, or movement through high- and low-volume areas. It also gives a visual record of where the market previously did business.
When options-derived levels may add more
Options levels can add context when a major strike or transition area sits away from the obvious volume structure, or when you need another potential target beyond the current node.
A combined workflow
- Build a Volume Profile using the period required by your strategy.
- Mark only the nearest high- and low-volume areas that affect the trade.
- Enter the ticker in Eden.
- Compare current price with nearby options-derived levels and targets.
- Note any areas where the two maps overlap or disagree.
- Define the reaction required before entry and logical invalidation.
An overlap can deserve attention, but it does not promise a reversal. A disagreement can help you see that the trade has competing context.
An illustrative example
Suppose price sits above a high-volume node while an options-derived resistance level is just overhead. The volume area may support acceptance at the current price, but the options level may limit remaining room. A trader can wait for price to clear and hold the overhead area before treating the move as open space.
This example is educational and not a recommendation.
Which should day traders follow?
Follow the method tied to your tested setup. Use Volume Profile to understand where trading activity accumulated. Use options-derived levels to add positioning context and potential destinations. Do not choose whichever line supports the trade you already want.
For session-average context, read Options-Derived Levels vs. VWAP. For confirmation with price and volume, read How to Use Volume Price Analysis at Key Levels.
Frequently asked questions
Is a high-volume node always support?
No. It shows an area of substantial past trading. Current price can accept, reject, or pass through it.
Are options-derived levels better for targets?
They can provide potential targets, but every target remains conditional. Volume areas can also become useful destinations.
Should I keep both maps on one chart?
Only keep levels that change a decision. Too many lines can hide the setup instead of clarifying it.
Takeaway
Volume Profile maps where trading occurred. Options-derived levels add context about where options positioning may matter. Use both when they perform separate jobs and reduce the map when they do not.