Decide what you are willing to lose
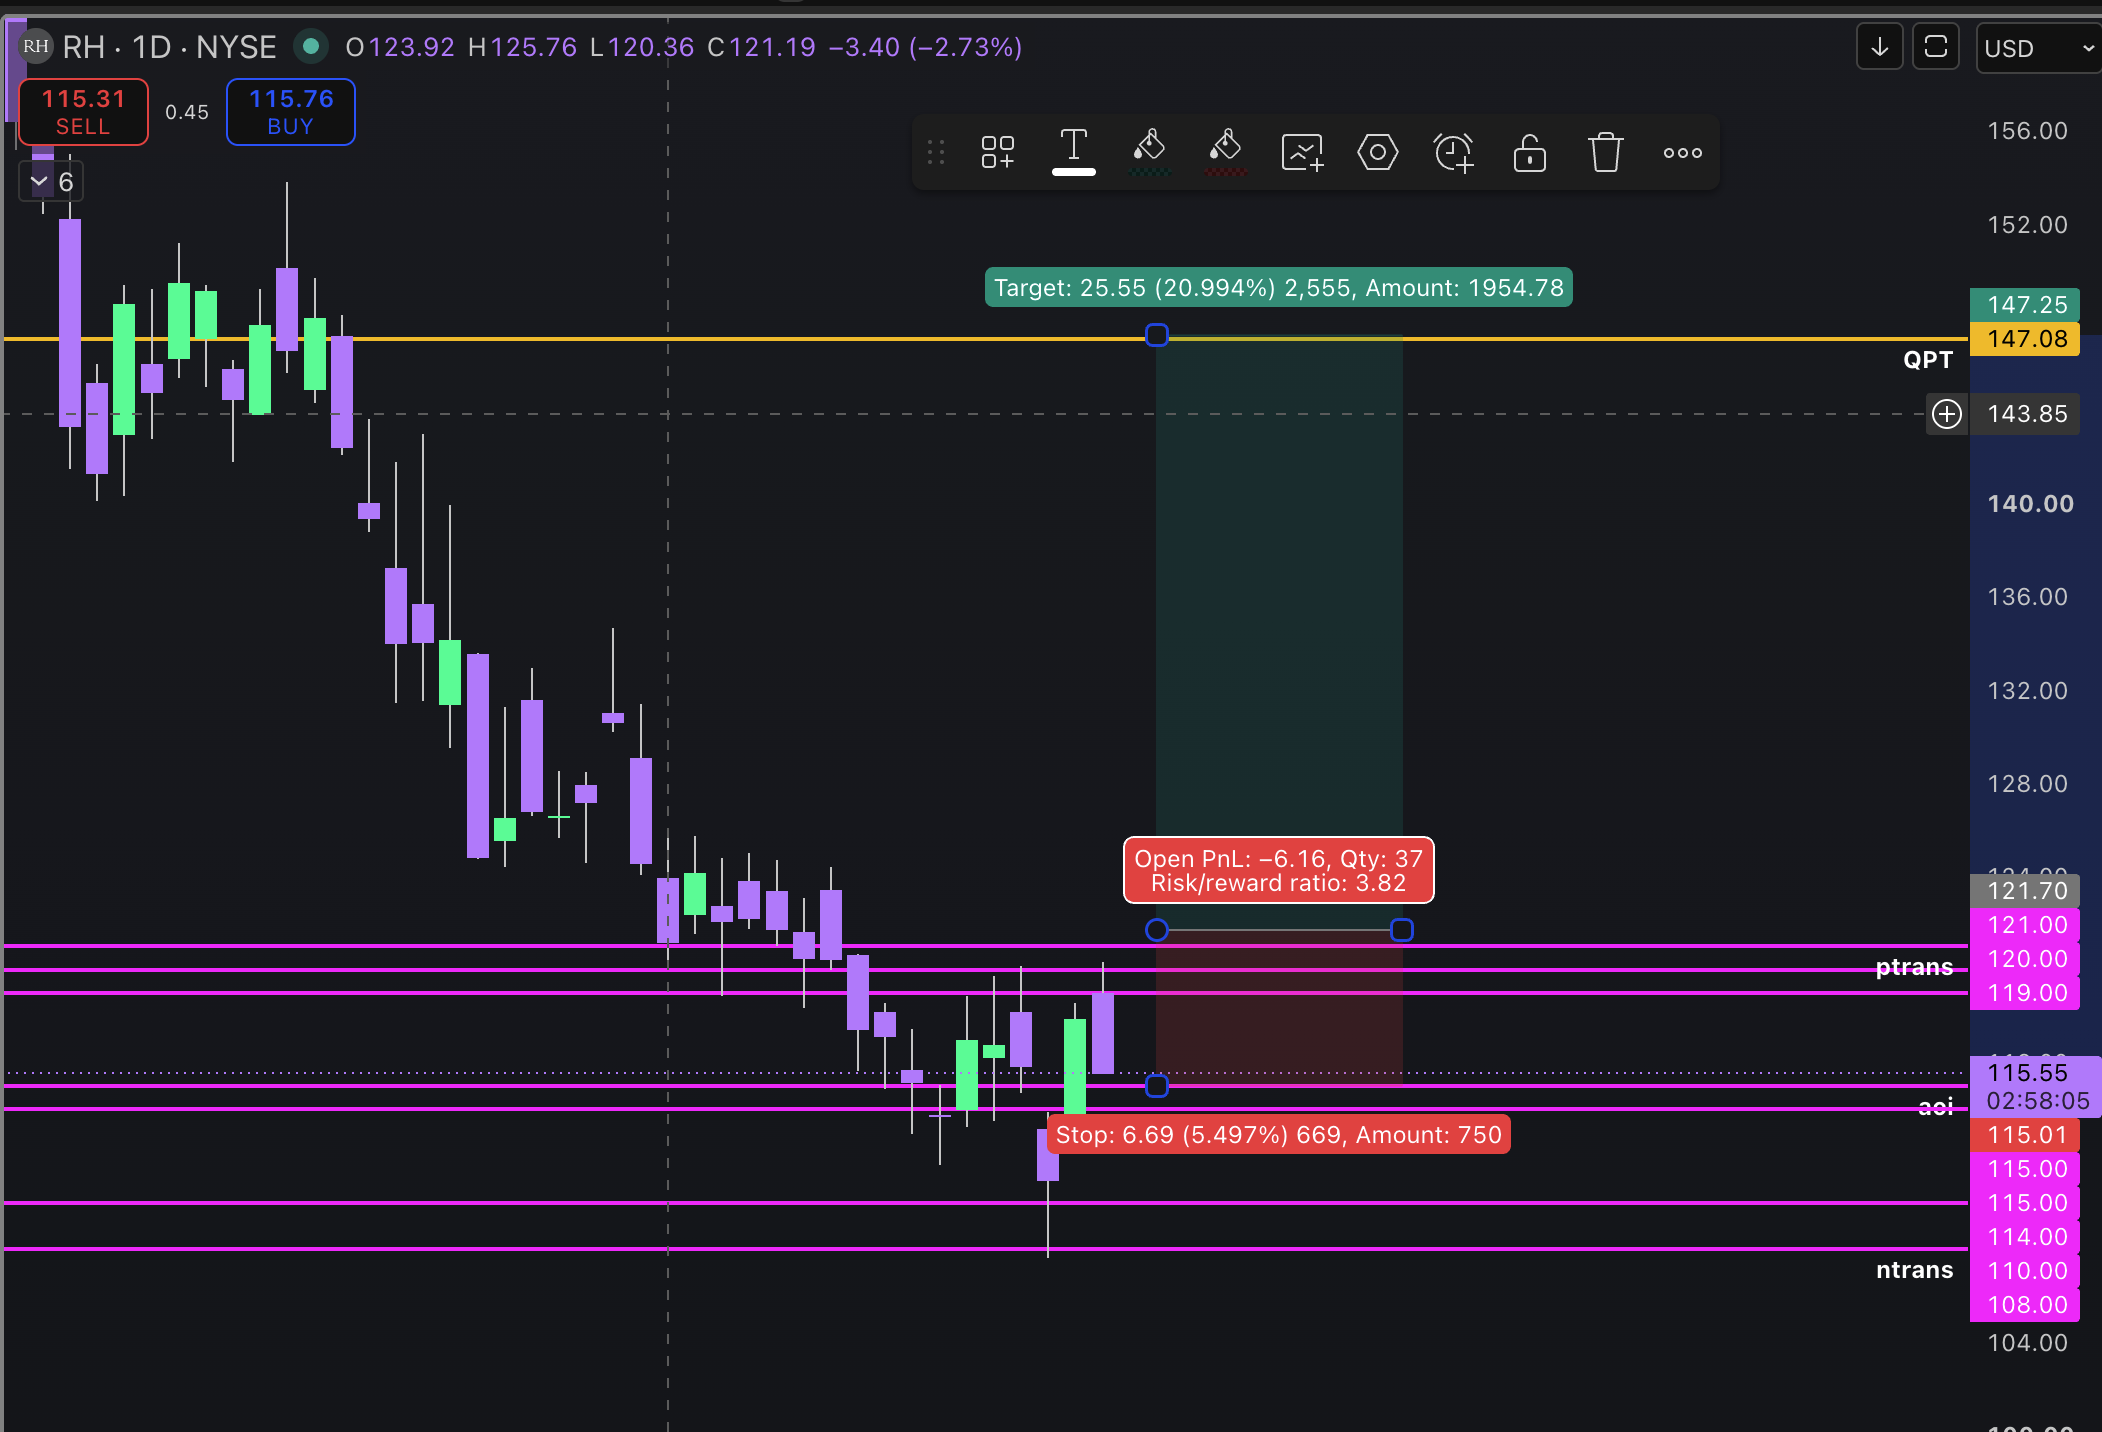
The RH map now has an entry near $121.70 and a quarterly target near $147.25. That creates about $25.55 of possible reward per share. Before entering, you still need to decide where the idea becomes wrong and how much money you are willing to risk.
Risk has two parts: the distance from your entry to your stop, and the number of shares you buy. Set both before placing the trade.
Choose an invalidation level
Your stop should sit at a price that changes the reason for taking the trade. For the RH long plan, there are three levels you could use:
For this example, we will use the strong AOI near $115.01. The stop is tied to a level on the map instead of an amount chosen only to make the numbers look better.
Check whether the reward is worth the risk
- Possible reward
- $147.25 − $121.70 = $25.55
- Planned risk
- $121.70 − $115.01 = $6.69
- Reward to risk
- $25.55 ÷ $6.69 = 3.82
The chart shows about 20.99% upside to the target and 5.50% downside to the stop. That gives the trade about 3.82 units of possible reward for every one unit of planned risk.
Choose the account risk
Decide how much of the account you are willing to lose if the stop is reached. For a $100,000 account, these example limits produce different dollar risks:
Conservative example
More aggressive example
High-risk example
We will use 0.5%, or $500, for the RH example. Choose a limit that fits your own plan and follow it consistently.
Calculate the position size
For RH, the planned risk is $6.69 per share. Divide the $500 account risk by that amount:
$500 ÷ $6.69 = 74.74 shares
If your broker requires whole shares, round down to 74 shares. At a $121.70 entry, that position costs about $9,005.80 and puts about $495.06 at risk before fees and slippage.
Let the share count adjust
A wider stop creates more risk per share, so the formula gives you fewer shares. A tighter stop creates less risk per share, so the formula allows more shares. The planned account risk stays near $500 either way.
A stop order may fill at a different price during a fast move or an overnight gap. Treat $500 as the planned risk, not a guaranteed maximum loss.